Running shoes or sports footwear tend to be pretty expensive. Ever wondered what does it cost to produce them, and what kind of money do brands and stores make on a pair?
For as long as we can remember, we’ve been reading comments such as these on the internet:
‘ Nike makes their shoes for $2 dollars.’
‘ The Yeezy Boost costs $10 to make and adidas sells it for $350. adidas makes a $340 margin’.
‘ Sneakers could be considerably cheaper if brands stopped paying all that money to Kanye West, Stephen Curry and Lebron James’.
‘I bought a shoe worth $200 for just $50 on Black Friday, and the shoe company is probably still making a lot of money.’
Frankly, we’re surprised that no one has published exact manufacturing costs for specific models, considering this is such a widely discussed topic, and the cost information isn’t particularly hard to get. There’s only one relevant precedent. Back in 2014, Matthew Kish, a journalist with the Portland Business Journal did write about the average cost to make a pair of $100 shoes.
We thought it would be even more helpful to tell you what are the exact costs involved to make specific models, and what kind of profits entities involved in the business ultimately end up making. Because as you’ll soon discover, factory costs happen to be only a tiny part of the entire story.
For fun, we’ll throw in the actual production costs of the adidas Yeezy Boost 750 and the D-rose Boost too to see how they compare to their counterparts in the running footwear category.
Not only that, we’ll tell you the financial workings of full price vs. discount retailers, and the kind of impact endorsement money has on a price of a shoe. The answers surprised us; the chances are you will be too.
The individual costs mentioned here are 95% accurate, and are factory or ‘ FOB’ costs. FOB is short for ‘Free-on-board’ (also called freight-on-board at times), which is the cost of shoe when loaded on the vessel at the port of origin – usually in the country where the factory is located.
The term is self explanatory – by quoting the FOB cost, the supplier means, ‘Hey, we’ll take care of transporting the finished shoes till the shipping port. It’s free till that point, and once the shoes are on board the ship, it’s your problem.’
However, what we don’t have is the material break down of each FOB cost. In the industry, this is known as the BOM – short for bill of materials. This itemizes the cost of each and every component used in the shoes, based on their consumption in a single pair.
Think of it as a list of ingredients in a cooking recipe, except that the list is marked with how much each ingredient cost you to purchase.
For a typical running shoe, the BOM will add the consumed cost of synthetic leather, mesh, threads, logos/inks, trims, midsole, outsole etc. The final costing sheet also includes the labor and overhead (LOH) costs. Very often, the cost of making the expensive sole molds is spread across/amortized a particular model too.
The BOM information is confidential, restricted to the product team involved in creating a particular shoe model. For that reasons, we do not have individual BOM’s and costing sheets.
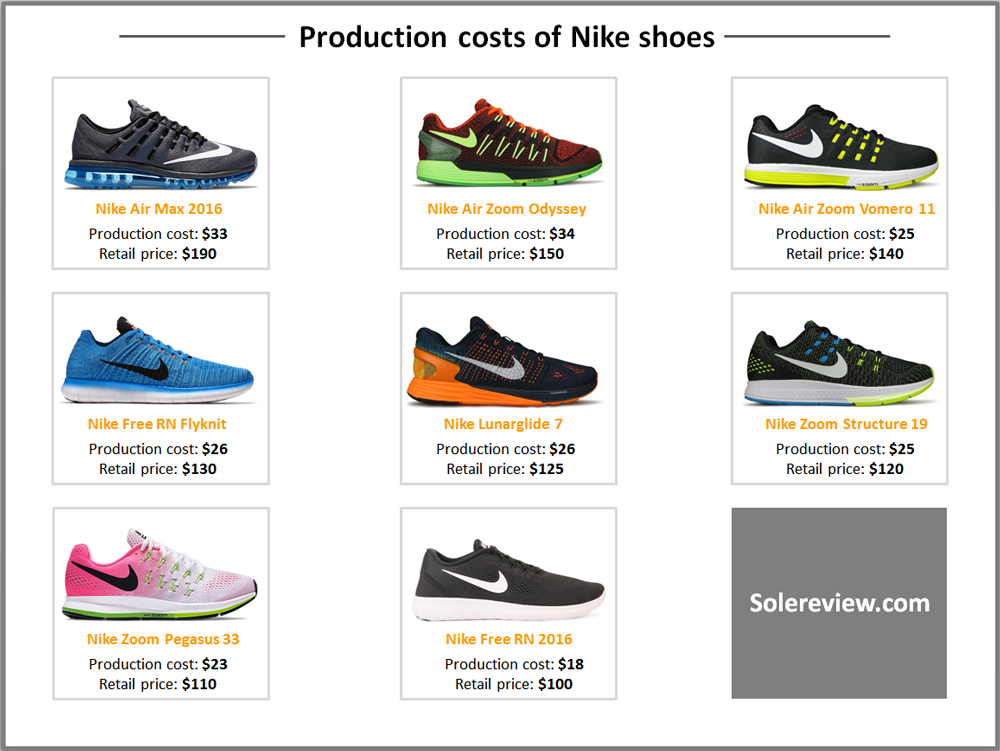
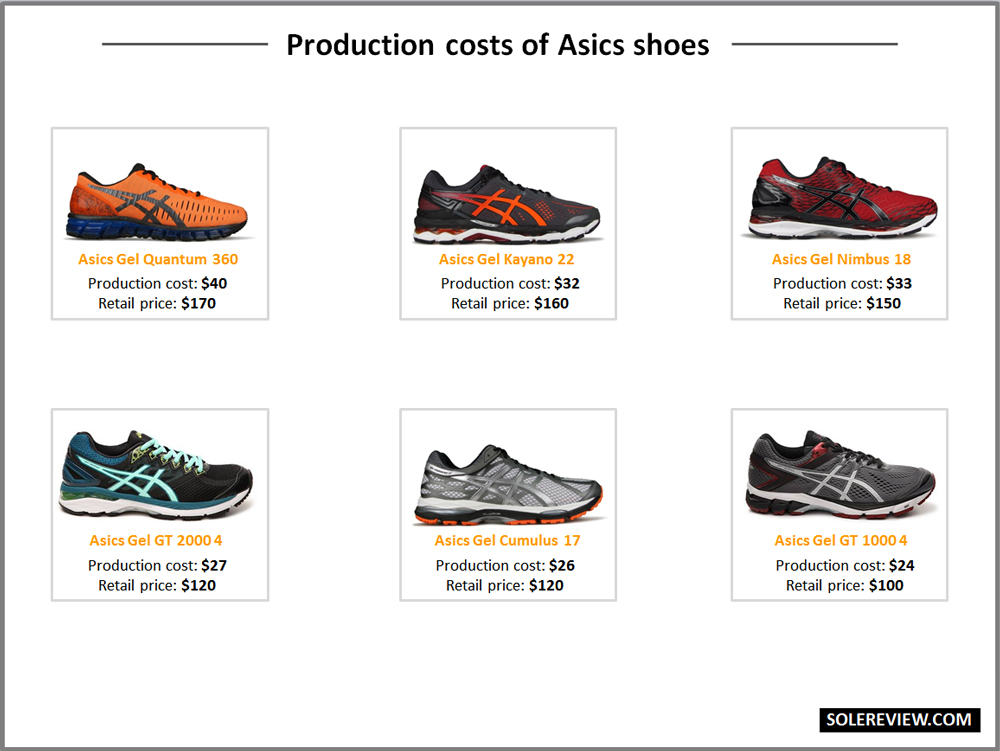
Let’s get straight to the point, shall we? We chose 22 shoe models from adidas, Asics and Nike, and the infographic which follows shows you what it cost to make each one of them. We looked at the average cost of different colors across a single model, because factory costs differ based on the color.
It must be mentioned that individual sizes do not have their own FOB costs. If a shoe is available is sizes US 6-13, then the cost mentioned will be for the mean/median sizing, say a US 9 for men’s footwear.
So regardless of whether a brand is buying a US 11 or a US 7 for a specific shoe, the cost will stay the same across sizes. Similarly, a different mean costing size would exist for women’s and kid’s shoes.
The numbers you see below are the FOB costs for specific shoe models, based on Jan-May 2016 ocean shipping data. Publicly available US import data does not contain itemized FOB costs, nor is the database current/comprehensive, so we had to compile the data from international imports and exports. Hence the variation of 5% due on the account of currency conversions to the US dollar.
There’s a good reason why we chose adidas, Asics and Nike for this exercise. They are public companies, giving everyone the access to their income statements. That allows us to tie in other calculations to the cost of the shoe, and deduce the average profit made by brands on each pair.
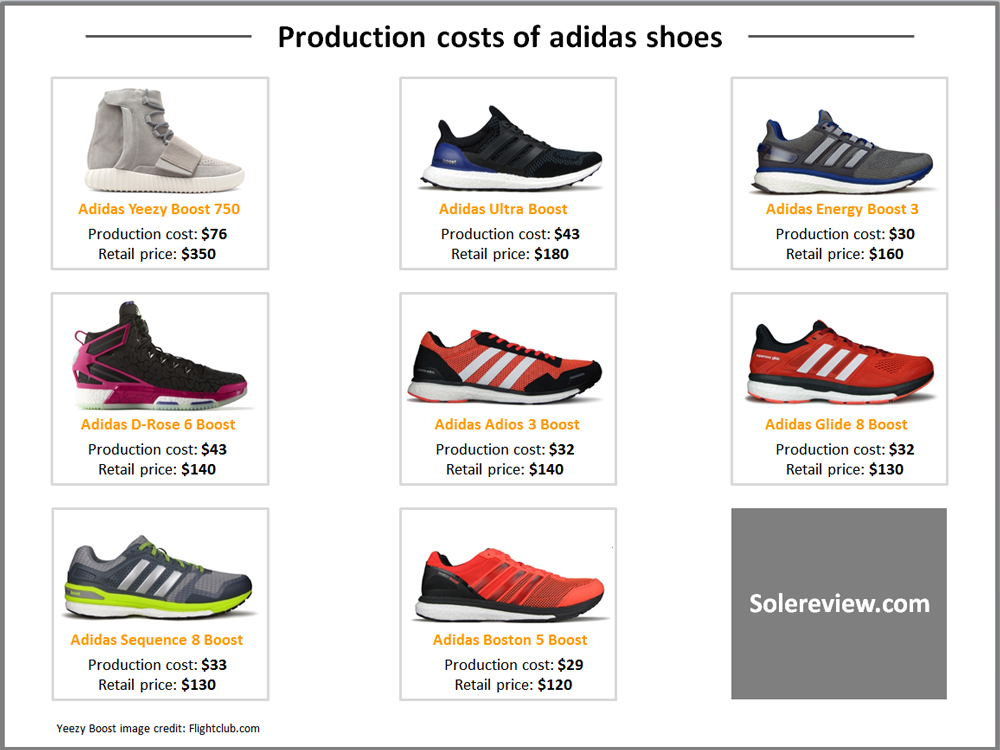
Let’s kick into high gear, then. In the absence of any context, this infographic seems obscene. A shoe (adidas Energy Boost 3) which sells for $160 costs $30 to make? That’s a profit of $130 per pair! Shoe companies are truly ripping us off!
But that is as good as looking at a person who earns a salary of $300k a year, and say, ‘300k a year? That guy can save a million dollars in 5 years.’
That makes no sense, does it? Because out of the 300k salary, one will have to account for mortgage and car payments, education loans, insurance, food, fuel costs, taxes and what not.
So while $300k a year is a comfortable salary to live on, the actual savings left over after expenses is a mere fraction of that. An apt analogy would be to equate your salary to the retail price of a shoe, and your minuscule savings to a brand’s net profit after tax.
Last year, adidas made a paltry 4.1% in net income (read footnote #1) after taxes, and Nike made 10.7%. But remember that brand income statements are based on wholesale revenue and not retail price.
So if you had to calculate the brand margin as a percentage of the retail price, then adidas and Nike made a 2.05% and a 5.3% profit respectively. This is assuming that the wholesale revenue is half of the retail price. (We’ll explain those terms in a bit)
In other words, for a shoe priced at $100, adidas earned just $2.05 and Nike made $5.3. But didn’t we just say that a $160 shoe is produced for $30?
So where does the rest of the money disappear?
1) The big picture: Landed costs, wholesale revenue and gross margins
The factory cost only represents the first step of a finished product’s journey. As it leaves the country of origin (where it is manufactured), additional costs get piled-on, leading to the landed cost.
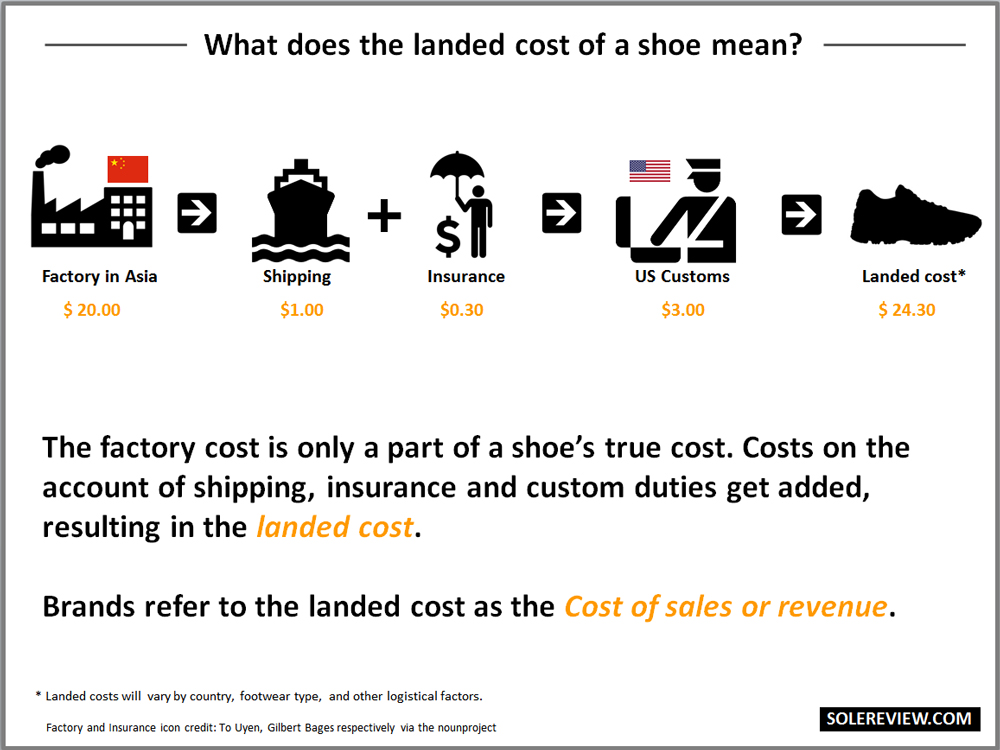
Since the FOB cost only covers the stage of transporting the shoe from the factory to the local sea-port, the brand has to cover the cost of transporting it from Asia to the United States.
It is also possible the ship might run into a nasty storm, and drop a few containers containing thousands of sneakers into the ocean (Yes, this has happened). So the brand has to pay for insurance to cover for any unforeseen circumstances. This works exactly like buying personal travel insurance with your air ticket.
At this point, the factory (FOB) cost has transformed into a Cost+Insurance+Freight (CIF) price. That’s before the shoe gets off the boat and meets Uncle Sam’s army of custom officers.
When the shoe finally reaches a US port, the shipment is assessed for custom duties. The custom duty calculation is extremely complex, relying on the elaborate harmonised tariff code (HTSUS) system to assess how much duty is to be paid.
There are different duty structures even for the same commodity. So one type of footwear can have a 10% rate of duty, and another could be as high as 20%.
At this point, the factory cost has turned into cost+insurance+freight+custom import duties. This is known as the landed cost, which as you can see in the calculation, is 21 % higher (approximation, could be lower) than the factory cost. In corporate business reporting, the landed cost is used to derive the ‘cost of sales’ or ‘cost of revenue’. (read footnote #2)
And what exactly does net sales or revenue mean for a brand?
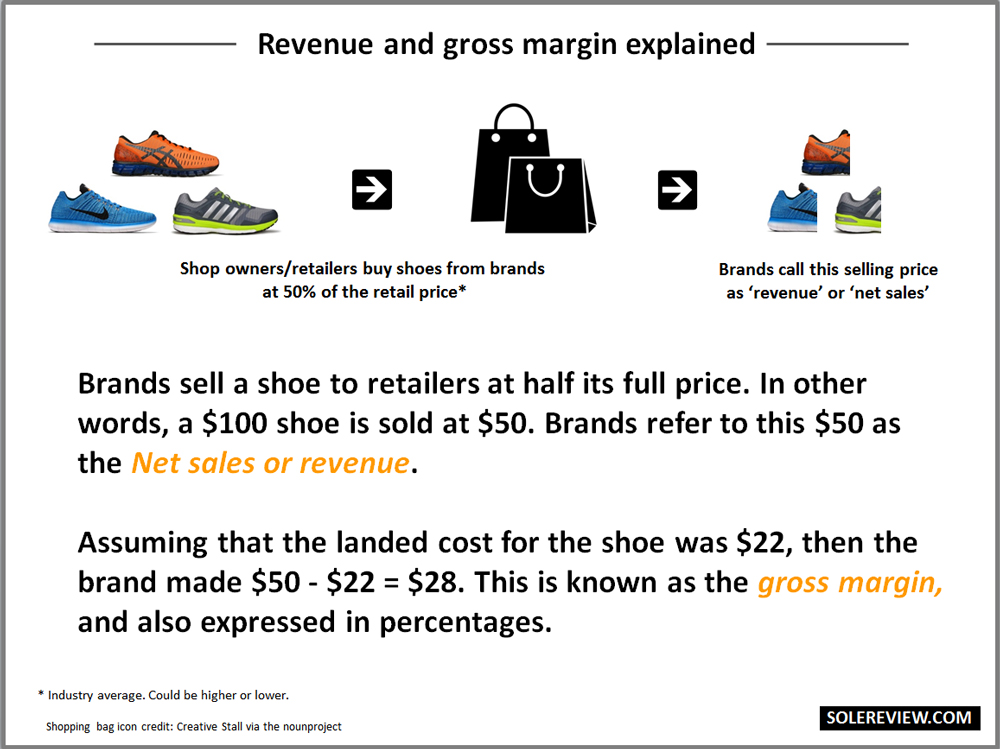
When buying a pair of shoes, you might not necessarily do so directly from the brand. You’ll probably head over to the Roadrunnersports or Zappos website, or perhaps your local Footlocker, Dickssportinggoods or family owned running store. These stores and chains buy it from brands such as adidas and Nike, who in turn offers them a margin to cover their operational expenses and make a small profit.
The discounted rate offered to retailers is known as the ‘revenues or net sales’ for the brands. The industry average for retailer margins is approximately 50%, which means a brand like adidas or Nike sells a $100 shoe to their partners for $50.
(Update: We’ve got a lot of feedback saying that retailers do not get a 50% margin. The bottom-line is, the 50% number is an accurate representation.)
The calculations work differently when brands operate their stores or websites, because they are selling to customers directly. However, direct sales is still a small part of an athletic footwear brand’s business. For all practical purposes, one can assume the net sale to be the number arrived at after selling to retail or wholesale partners.
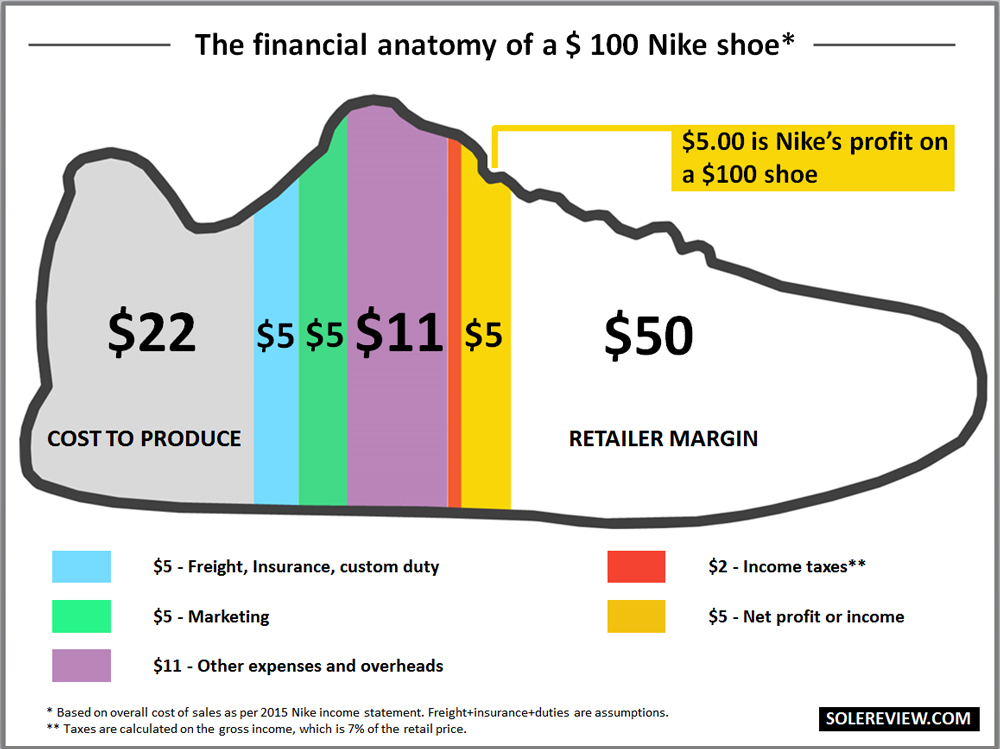
The difference between the landed cost (cost of revenue) and price offered to retailers ( revenue or net sales) is known as the ‘gross margin’ in accounting lingo.
As you can see in the infographic above, a $100 shoe ends up being $22 in landed costs and the brand sells it to a third party retailer for $50. For a brand, the gross margin in dollar value is $50-$22= $28.
In percentage terms, it will be $28/$50 x 100 = 56%. This gross margin number is included in income statements made available to Wall Street.
So far, so good. But we haven’t discussed other expenses, like the cost of running a shoe brand. What do those numbers look like? Fast forward to the next part, then.
2) The fine print: Other expenses, taxes and net profit
The gross margin of any respectable brand will be in its high 40’s. In 2015, adidas had a gross margin (Net sales – landed product costs) of over 48%, while Nike made 46%, a full 2% lower than adidas. Asics made 44%.
Numerically astute readers might notice a disconnect. Based on our first few infographics (containing the sample footwear assortment), it appears that some of the adidas running shoes cost much more to make than similarly priced Nike shoes. So if Nike running shoes costs less to make than adidas, how can they end up with a lower gross margin?
We can make an educated guess. Firstly, from a product standpoint, adidas sells a lot more apparel than Nike, and generally apparel is a higher margin business. Nike has always been a footwear brand, and that shows in their numbers.
For the combined sales numbers of footwear and apparel, Nike sold 68% of footwear and only 32% of apparel. In what’s a stark contrast, adidas’s sales split was 55% footwear and 45% apparel. The fact that Asics’s gross margin (44%) is lower than adidas and Nike lends credence to our theory. After all, Asics’s business is 84% footwear.
It is also possible that other categories like adidas Originals footwear delivers a higher margin than running footwear. The white adidas Superstar for example, sells for $80, but is produced for $16. That makes the production cost a mere 20% of the retail price, hence delivering a much higher gross margin.
But the footwear/apparel/category mix is just one of the many factors which can raise or lower margins. Actions like deciding who to sell products to – some sales partners or channels are higher margin than the rest – or making the supply chain efficient are some of the other ways to boost brand gross margins.
If a company runs its own stores, then reducing expenses and upping merchandising efficiency to decrease discounted sales and/or increase higher margin product sales is another way to help margins.
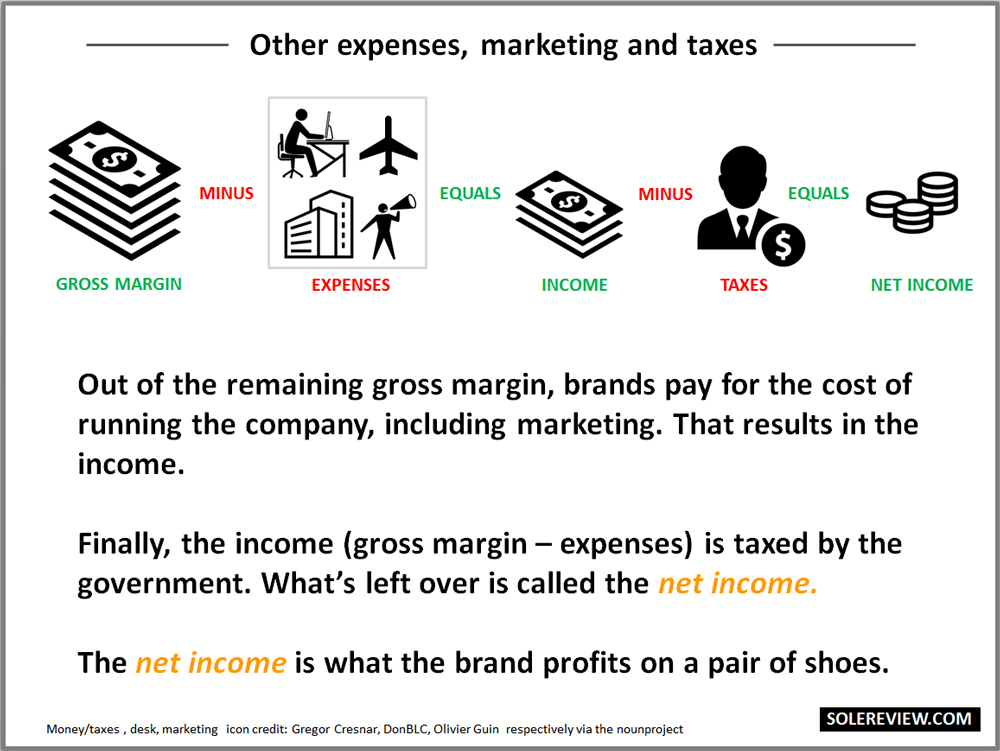
Out of the total gross margin, brands will have to pay for staff salaries, distribution costs, marketing, depreciation, taxes and other business related expenses. Fortunately, most of these numbers are available for everyone to see, as long as the brand is publicly traded.
It just so happens that adidas and Nike are public companies, so we have our work cut out for us.
Marketing forms a big part of a brand’s expenses, no two ways about that. In 2015, Nike spent over 10% of its net sales on marketing, and adidas spent even more, at 17% of net sales.
For all other expenses other than marketing, Nike spent 22% last year and in adidas’s case, the German brand spent 26%.
The taxman also needs his cut, so in 2015 Nike and adidas paid 22% and 34% respectively. After spending all that cash, what’s left is the net income. As mentioned previously, that happens to be 4.1% of net sales for adidas and 7.3% for Nike.
3) Putting everything in perspective
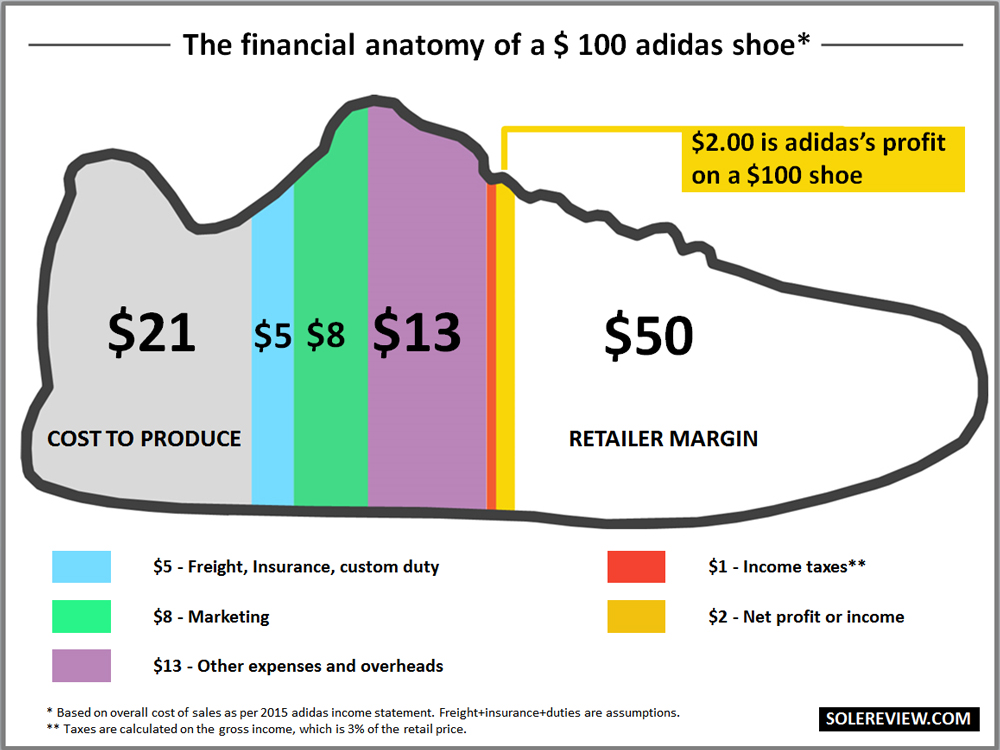
By now, we have a pretty good hang of the costs involved in the footwear business. But wouldn’t it be cooler to see all these slices as a part of a shoe’s retail price?
So let’s do exactly that; we’ll carve a $100 shoe into different costs elements, right from the factory cost to the retailer margin to the final profit per shoe. This reflect the averages based on adidas or Nike’s annual financial statements.
Looking at the overall picture doesn’t seem so rosy, does it? On a pair of $100 shoes, adidas just makes a profit of $2. Nike fares much better, making $5 as profit on a pair of $100 running shoes.
As it turns out, running a multi-billion sneaker business is not all it’s cracked up to be.
Other fun stuff:
By now, we’ve got a good handle on the financial workings of the shoe industry, at least on the brand side. But before we wrap up, it’d be nice to cover a few more topics. For example:
4) If a brand is paying retailers a 50% margin, then perhaps those guys are making tons of cash? What does the retailer profit look like?
Great question, so we’ll repeat the same cost analysis exercise here. Footlocker would be a great example to reference; after all, they’re one of the best performing companies in its category.
And much like Nike and adidas, they’re public, giving us visibility to their financial health. Without further ado, here goes:
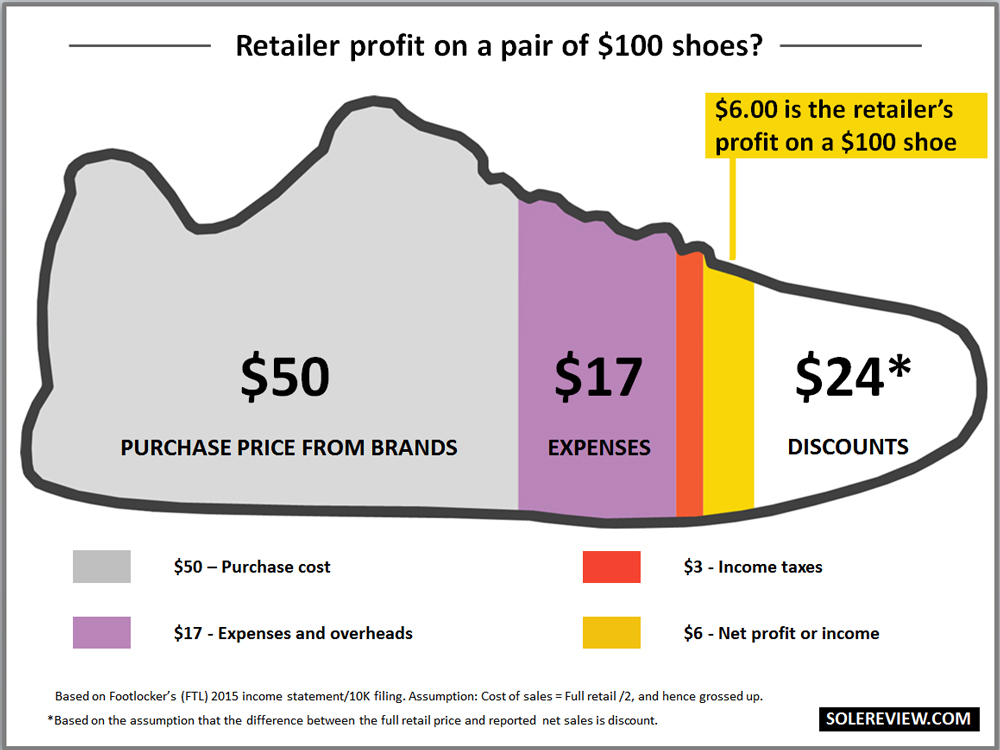
When you look at the split here, you being to realize that retailers don’t make a great deal of money either, do they? To start with, it’s pretty obvious they aren’t able to sell what they bought from the brands at full sticker price.
Footlocker’s purchase price (read footnote #3) for every sale of $100 shows up as $66 in their financial reports, and not $50. In plain terms, Footlocker sells its merchandise for a 24% discount on the average.
And how does that happen?
Well, you know, black Friday and thanksgiving sales, promo codes, regular markdown discounts and the like. Needless to say, 24% of the shoe’s price goes to the customer who buys it!
And what happens if brands skip the retailers and operate their own stores? adidas and Nike already have their own shops, but direct-to-customer retail comes with its set of challenges.
Brands will incur costs otherwise absent in the wholesale business model; spends like leasing+manpower+operational costs, store set-up and periodic re-modelling cost, the entire risk of inventory, and costs associated with warehousing and distribution. That’s only at the store level, there will be additional off-site resources needed in the back-end to support retail operations.
The brands will make some extra margin selling out of their own stores, but the best case scenario will be an additional 10%, which is slightly above what a highly evolved retailer like Footlocker makes annually after taxes.
4.1 If all what we’re saying about wafer thin margins is true, then how does a bargain retailer with its discounted price model make any money?
Though the business model differs across brands, some basic principles apply in this retail model. Firstly, the factory store is located in an area with lower leasing costs. If you’re visiting a factory or discount store, then it is very likely that you’ll arrive at your destination after driving for 30 miles to the middle of nowhere.
Middle of nowhere means that brands have to pay lower rents and wages compared to full price locations. Some chain-stores like T.J. Maxx are located downtown, but far from the premium high streets. T.J. Maxx also leases cavernous amounts of retail space – their average store size is a mind boggling 28,000 square feet – so they can easily negotiate much better rentals.
Secondly, most discount chains also operate with lower staffing. After all, you don’t need production education in a bargain store. The only thing which customers need to be educated about is the attractively low price, and that’s right there on the ‘before and after’ price tag.
Factory/discount stores are engineered to accommodate a higher merchandise density. Instead of athletic mannequins and spacious footwear walls, factory stores are crammed with merchandise.
Combine this with healthy sales and lower retail costs, and you’ll likely achieve a better operational cost than full price stores. It must be noted though, that the square foot sales of a full price store like Footlocker is much higher than say, a T.J. Maxx.
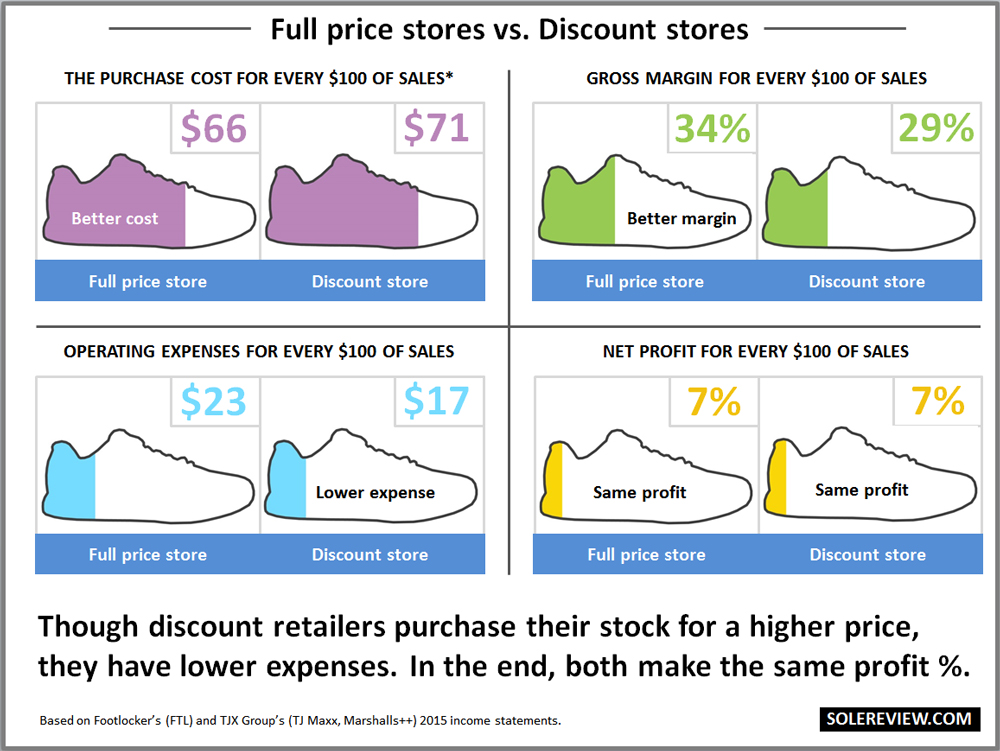
And do you know much net profit a company like T.J.Maxx makes after taxes? 7.5%, which is more than what adidas took home last year.
What’s even more impressive is that they manage to do so at a gross margin which is exactly 20% lower than adidas, and 5% lower than traditional retailers (see below). This simply means that their expenses are lower.
And at a time when full price stores are shuttering down, discount chains are actually reporting sales growth and opening new stores, not closing them.
In terms of size, T.J. Maxx sold $30 Billion of merchandise last year. That’s bigger than the Nike brand, we’d like to point out.
4.2: What is the impact of the endorsement money paid to celebrities, athletes and teams on the price of a shoe?
The simple answer is: not as much as you think.
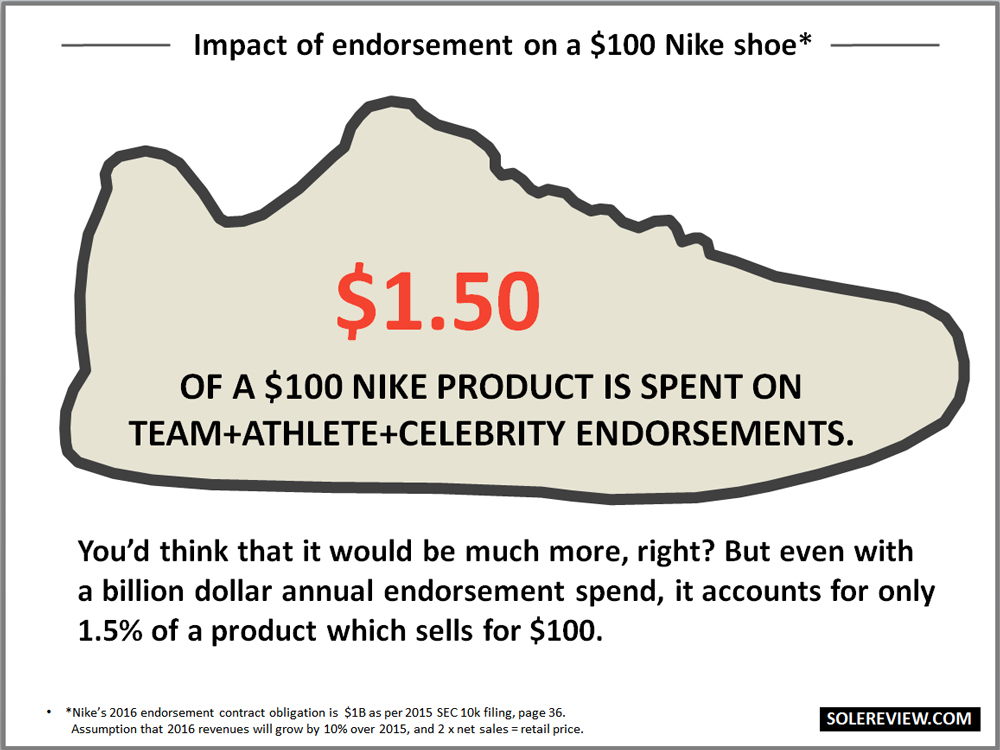
This year, Nike will pay a whopping $1 billion for all its endorsement needs. This includes all the superstar athletes, sports teams big and small, and the occasional celebrity. Sounds like a lot of money, right?
But that’s chump change in context of the big financial picture.
Last year, Nike spent $3.2 billion on marketing alone. That makes the $1 billion number 30% of the total marketing spend. We know that the marketing component is $5 in a shoe which retails for $100. Hence, 30% (endorsement spend) of $5.00 (total marketing spend) is just $1.5 dollars.
4.3: How can knock-off products sell for so cheap, though they look near identical? Are those products made in the same factory as the regularly priced shoes?
Running shoes, or for that matter any type of athletic footwear, is not a space rocket. If you remove the marketing, then all you have left over is a few pieces of mesh, foam, threads, glue and sole parts.
Anyone with the right kind of manufacturing equipment and skilled labor can reverse engineer a popular sneaker design. That said, there are a few differences.
The knock-offs are made in completely different factories, and with lower grade materials. The factory will have lower standards for everything, including wages. Wages as such are low in Asia, and in dubious factories even more so.
After Nike’s fiasco in Indonesia a couple of decades ago, big brands are doubly careful not to fall foul of public opinion. So all contract suppliers are rigorously audited and prodded towards making compliance related improvements. Brands do that not because of the goodness of their hearts, but to avoid another PR disaster.
Bringing up shoe factories to meeting compliance standards (labor, environmental and process safety) is an arduous process, increasing operational costs in the process. And even after all this, factories are far from perfect.
By adidas’s own admission, over 30% of their factories have compliance issues. Nike is in a similar position. Going by by their financial year ’12-13 corporate responsibility report, 32% of their factories are rated below Nike’s bronze (acceptable) standards.
But for whatever it is worth, brand factories are an expensive place to make shoes. Not an ideal place to make cut price knock-offs. That’s besides the fact that any approved supplier stupid enough to produce dubious merchandise will have them immediately struck off the list.
Also, there’s this whole myth of cheap Chinese labor. It used to cheap maybe 15 years ago, but not anymore. Do you know much of adidas footwear is made in China nowadays?
In their 2015 annual report, adidas mentions that Vietnam now accounts for 41% of their footwear manufacturing, followed by 24% in Indonesia and finally 23% (-4% down from 27% in 2014) for China. Vietnam is the last bastion for premium athletic footwear manufacturing before it implodes from a wages perspective.
4.4 What profit margins do factories make?
The median is between 7% to 10% (on the factory cost) before taxes.
Note:
#1. 2015 adidas net income was 3.8% because of losses from discontinued business. We have excluded that because we want to represent what a normal income scenario would look for continuing businesses. In this case, it was 4.1% after taxes, a number which we referred to.
#2. This article intends to describe a very top level overview of what goes on in the industry, so some terms have been simplified. We constantly refer to the cost of revenue as the landed cost. The accurate accounting description would be beginning inventory + purchased inventory – ending inventory, but in the end, it would just translate into the landed cost of the sold inventory. This simplification also applies to describing the gross margin to net income conversion, among other financial terms.
#3. Footlocker’s annual report reflects only the net retail sales, and not full retail price sales. So for the sake of this exercise, we assumed the cost of goods to be half of the full sticker price.
115 comments
Great article! Very interesting, wonderful that it is so comprehensive.
Thank you! Took over 10 days to complete :)
Thorough, excellent article. Great job.
One thing I am wondering, and this is sort of an intangible, perhaps. You broke down how thin profit margins are, and that it’s by sheer volume that the business is sustainable. Is there any aspect to the running shoe business that has specific challenges outside of econ 101? Meaning, and here’s the intangible part, are we runners weirdos in a specific sense that shapes how shoes are marketed to us?
For my part, as a dedicated runner, I have 3-4 pairs of shoes at any given point (trail, road, race, beaters), and rotate through 2-3 of those every year. Given that volume, I tend to buy older models at discount (which, per your charts, suggests no one is making any money off them). It makes me wonder if the shoe companies rely on gimmicks and huge marketing (Metarun comes to mind) to push those new models as much as possible, as very quickly they hit the discount stacks.
That’s a good question, and don’t think solereview has an answer for it! One of the things that the larger brands have started doing is to make their products palatable to a larger audience instead of specific consumers groups.
So while categories like lifestyle and performance were clear in distinction 10 years ago, the lines have blurred today.
Great article, thanks!
You somewhat lost me on your Footlocker calculations though. You say they show net retail sales on their P&L statement but how do you get the 24% discount from that? Do you have sell in numbers? Also the text shows $66, shouldn’t it be $76 to get to 24%.
EDIT : did you use the COGS from their P&L maybe and multiply it by 2? Might want to clarify ;-)
Great question.
Yes, there are some assumed numbers there (not part of the public filing), so would be happy to clear that up.
Let’s reference the exact 2015 FTL numbers. FTL had $7.4 billion of revenues on a $2.5 billion Gross margin, so this makes the Cost of Sales as $4.9 billion. (66% of revenue)
Now comes the assumption part. We assumed that FTL’s net purchase price was 50% of retail price, so the full price value of $4.9 B was twice that – in other words, $9.8 B.
In this case, the net sales of $7.4 B is lower than the assumed full price value of $9.8 B.
So the calculation would be $7.4 B over $9.8 B = 76%, which means a 24% discount.
Hope this make sense?
And we do not have the sell-in numbers. Revenue realized in 2015 would derive its cost of sales from an inventory mix of beginning of period inventory (2015)+ purchases (current year 2015 sell-in) – ending stock (mix of both).
As such, the discounts makes perfect sense, even if 24% might not be entirely accurate. The $7.4 B sale should come from a combination of discounted aged inventory (end of 2014 or beginning of 2015 inventory), full price sales of 2015 sell-ins, and partial discounting of 2015 sell-ins on the account of seasonal aging or slower sell-thrus than expected.
Naturally, solereview is not privy to exact sell-in/full price numbers, and the purpose of this exercise was to give a general idea of how this industry works. Don’t hold us to it! :)
There is a footnote inside the infographic on the COGS x 2 thingy.
Good Job! I thought you explained things well. One item you did not touch on was the comparison of depreciation and amortization costs between Nike and Adidas. Since these are non-cash expenses, any large difference would significantly impact the cash available for re-investment or return to shareholders. Was there a great difference?
Secondly, without looking at the financials (lazy me) I would have assumed that the reason Nike apparel sales to footwear sales is lower than Adidas is because Nike footwear sales are so strong, rather than Nike apparel sales are weak. In absolute dollars, rather than percentages, does Adidas sell more apparel than Nike?
Thanks again for your hard work in putting this together!
We sought to keep the tone of voice as simple as possible, so we felt that covering other aspects of the business was beyond the scope of this article.
That said, we would have anyway struggled with presenting a clear picture of the depreciation/amortization costs across both the brands.
While depreciation on fixed assets like plants, property and machinery could be assigned a standard depreciating rate (and most of the dollar value is captured in the BLS anyway), analyzing amortized costs on intangible assets will be extremely difficult.
For a like to like comparison across adidas and Nike, we would first need to know the exact split of the intangible assets, and more importantly, the assigned finite life (+ residual value if applicable) for each of those items. Because with different appropriation methods, the comparison could appear skewed.
If you’re referring to fixed asset amortization on the account of product development related tools, then it is captured in the cost of sales.
In dollar value, Nike sells more apparel than adidas. The purpose of mentioning the category split was to support our theory of how the GM could be influenced.
But adidas’s footwear is growing stronger. The latest Q1 2016 results show that apparel has dropped 200 basis points in contribution share (FTW+APP) vs. corresponding last year period.
An interesting point is that Nike Free RN is the cheapest to make – by a significant margin – yet the price is similar to other shoes.
This backs-up my theory that the latest ‘fashion’ for more minimal shoes is financially led.
Where 5 years ago, $120 would get you 2-3 densities of midsole, with gel or air pockets and a fancy plastic mid foot shank, you now get a simple wedge of single density foam on a single density outsole. No technical features whatsoever – 2 components, glued together.
Where one would have had a plastic heel clip, complex overlays and ghilly lacing on the upper, one now gets a single-piece upper with little/no additions. Even the logos are screen-printed, rather than stitched.
Today’s top-of-the-range shoes are similar to the base models of the ’00s, yet they cost twice as much. Case in point – the New Balance 1080 Fresh foam – same features and elements as New Balance 480v2 – should cost about the same.
It’s the Emperor’s new shoes.
We suspect that some of their more attractive products (say basketball or football) shoes are lower margin products, so shoes like the Free RN help with that.
But you’re right, brands will make more of such products as time goes on.
Virtually no shoes are a 50% markup. Wholesale to retail is in the 40-44% range. ($120 shoe has base cost- Asics GT2000 is $66) So your premise of Nike making only $5 on a pair of shoes could be bumped to $11. Virtually no major brand keystones their shoes. (22 years at current running specialty store- so I have long term familiarity with pricing of shoes)
(TLDR; the 50% margin mentioned in the infographic is an accurate representation. This is no other place to plug in the additional payouts – it is a part of the retailer margin.)
Finally! Glad someone asked, thank you!
You’re right, and solereview is right too, because both of us looking at the same thing with a different set of lens. Firstly, the financial workings in this article is simplified so that even people with no knowledge of the industry can understand it without getting caught up in the minutiae. Secondly, the calculations are based on the entire brand P&L instead of specific channels or territories.
The retail mark-up is based on many different components, and not just the initial wholesale/invoicing price alone. The wholesale price calculation for brands is based on the net amount paid to retailers (net payout of margin). That consists of fixed and conditional components like:
1) Base wholesale price. This is the initial mark-up for the shoes sold. So you’re correct, this could be anywhere between 35-50% range.
2) Volume discounts, or earned discounts.
3) Subsidies for mark-down allowances. (say during discount sales)
4) Stock corrections – return of unsold inventory.
5) Sales Tax or VAT sharing – in certain international markets, the commodity tax is part of the price, and not grossed up over it, which means the businesses have to bear it. Also, this is unlike the US market, where the onus of paying state sales tax is on the end consumer.
And how is stock correction part of the margin picture? When brands take it back from retailers, chances are they will sell it to a bargain retailer or find other ways of liquidating it.
When they do so, they won’t sell it for a base wholesale rate of 35-50%, more like 60-80%, depending on the age and condition of the stock. That will lower the wholesale rate, hence upping the retailer margin as part of the shoe.
Some of the extra’s mentioned here might not play a big part for a specialty running retailer, but it does so on an overall business level. Some big-box retailers and partners will get sweeter deals than the rest – that is the nature of this beast.
In the process, the law of weighted averages will kick in. The larger payouts given to them will drive up the overall wholesale margin from a overall business perspective.
I’ve been out of the sales side of the business for several years, but know that every retailer has a different go-in margin requirement. Matt may be correct for independents, but for major retailers like Dick’s and FTL, I believe their standard GIM is better than keystone: 53%-55%, because of their buying power.
Exactly.
Very good article and easy to read
Thank you for the feedback!
A very well researched and insightful article. Thank you for that. Keep up the good work. Look forward to more such articles from Solereview. Am a big fan of your shoe reviews:)
Thank you for the feedback, and for being a regular!
what nike-indonesia fiasco 10 years ago ? Indonesian here, just want to ask so you have better explanation to others about this :)
This:
http://www.businessinsider.in/How-Nike-Solved-Its-Sweatshop-Problem/articleshow/21122639.cms
Eye opening for me!
Reading this got me asking “Where can I find these manufacturers??!” any one has a hook up in Asia?
adidas factory list is here:
http://www.adidas-group.com/media/filer_public/2014/06/17/2014_may_global_factory_list_en.pdf
Nike Factory list is here:
http://manufacturingmap.nikeinc.com/
Great article, thanks for sharing. I’d be interested to know if the production costs that you found were all based on one particular order size? Or are these an avg cost for an order between say, 10/20,000 units?
Hi – the production costs are actual costs for the mentioned models. These are pulled from actual ocean shipping data.
Once the cost has been decided between the factory and the brand (based on demand forecast, among many other things), it does not change regardless of the order size.
Hm, Interesting, I guess perhaps at these levels and with these brands, that may be true.
However, this certainly does not reflect how it works for smaller brands. Particularly when not producing in Asia (Though I fully understand that data is a lot harder to get).
Yes, bigger brands have the leverage of scale.
We must point out though, that if a brand fails to meet a minimum order quantity when booking orders from retailers/wholesalers, then that shoe will be dropped from the product line.
For sure. However the unit cost for an order that just covers the factories MOQ is going to be quite different than if you place a large order.
True. But it works differently for bigger brands, because they have a highly evolved costing process. It starts with the targeted FOB based on the product design brief.
The designers/developers for the brands are in-house, and they have a pretty good hang of (helped by a lot of tools) what the design will end up costing – in other words, the initial design is already built to a cost.
Factories source their materials from sub-tier suppliers and a lot of that cost is already available to designers/developers beforehand. The product team will also factor in initial demand forecasts for that model.
The factory will sample that design, and relay back their own costs based on material consumption, labor spends. The design might go back and forth a bit depending on that information. The brand will end up with a final price, and that’s pretty much it.
Yes, in case a particular model is a runaway hit or has potential to be a successful franchise, then costs are renegotiated – which what you’re referring to.
Awesome stuff as usual. Keep up the good work mate!
Thank you for the kind words! Had no idea this article would go viral.
This is stunningly amazing reporting. Thank you for doing the research to produce it. The greatest take-home economic lesson here though is that obviously, Nike et al, have a huge motivation to sell directly via the internet from their websites and bypass retailers. Then they more or less keep the retail profits. Trust me, they’re not shedding a tear when retailers like Sports Authority go out of business.
Thank you for the comment.
True, as time goes by brands will transition to a direct selling model in order to increase profits. Although, Nike must be shedding tears for Sports Authority – at least for the $50 million they owe Nike!
http://www.bizjournals.com/portland/morning_call/2016/04/sports-authority-which-owes-nike-48-reportedly.html
Ouch. I didn’t know they owed Nike that! Yeah, that changes things a bit. I know small local skate shops really took a loss of sales when Nike started selling SBs online, because with free shipping and a better selection there’s no real reason to NOT buy from Nike for the consumer (aside from knowing you’re supporting your local shop and having the benefit of trying on stuff in the store). I run track and I cannot even find Nike’s top-end track spikes in running stores so there is no other option than to buy straight from Nike or a major retailer online like Eastbay. You won’t find Ja Fly 2s in a speciality running store—at not here in Florida.
The skate industry and Nike have a bit of a history, most of it controversial.
But you’re spot on – direct selling is the future for brands.
Can you explain the economics of FlyKnit and PrimeKnit and how they differ from traditional construction? Also, how did you source this as companies are notoriously tight lipped about new knit technologies. Thanks.
Knit uppers do not use many separate components, hence reducing wastage and labor intervention in the process.
Solereview does not know what is the price difference between a traditionally constructed upper and a knit upper.
The FOB costs for the shoes was sourced from shipping/customs data.
It would be interesting to know more about PrimeKnit for sure given how much it can increase the price on a model like adidas’ X 15.1 football boots.
The exact production cost of the adidas X 15.1 football boot (firm ground plate) is US $34. Will be more for a SG plated version.
Well written and a nice job of putting things in layman’s terms.
The world & industry is evolving and there will come a day where the carbon foot-print, transportation costs, duties and product lead-times will overshadow US labor costs and spark some domestic manufacturing. It is already happening in higher import duty/lower labor products like rain-boots(37.5%).
Also new brands that by-pass the traditional whole-sale model will have different opportunities/challenges than the brands we know today.
Makes a lot of sense to go domestic in higher import duty/lower labor products – after all, the major reason why brands source offshore is get the labor advantage.
The evolving business model is already setting a new set of rules. For example, there are stirrings in areas like retail leasing, where more and more landlords and developer demand a cut out of ‘sold online, picked up in store’ sales, even if the sales did not result from a pure walk-in customer.
One of many more to come, we guess.
3d printed and woven shoes will change all this soon.
Solereview did a piece on 3D printing too.
https://www.solereview.com/3-reasons-you-wont-see-mass-produced-3d-printed-running-shoes/
Got it – thanks for sharing your link!
I can’t believed Nike only have $5 profit on a pair of shoes
You don’t have to take solereview’s word – Nike’s income statements are public information.
Great article, well explained, accurate numbers, easy to understand for a larger audience. Nice job !
Thank you!
Congrats on the article, very well written and explained.
Thank you!
fantastic article and an eye opener. Have never seen anyone explaining with such details.
Appreciate the kind words! This was fun to put together.
I give you massive props for doing this. Be careful, the shoes companies know guys who have lots of vowels at the ends of their names. As a long time employee of running stores at diff. times of my life, it became clear that, essentially, every time a shoe passed hands it doubled in price. My goal, as a consumer now, is to get as close to the production cost of a pair of shoes whenever possible–just like anyone does with paper towels, furniture, toasters, or nail clippers. In the Brave New World of Running Specialty Group, I have no loyalty to anyone except my own wallet. Thanks for your continued work on this site.
Thank you for being a regular!
Hey, AMAZING WORK! Thanks for this. How do I contact you. I have a few specific questions I am extremely interested to get some answers to. Have you got a email?
Hey thanks! You can use the contact us section on the footer to send solereview an email. However, if you have questions specific to this article, we’d prefer to answer them here so that other readers can see it too.
Don’t fixed costs need to be shared by every single product / revenue stream equally?
Correct, and that’s what the $100 price breakdown represents. That infographic is nothing but adidas and Nike’s annual income statements represented if their entire revenue (in full retail price) was $100 – in other words, a % split expressed in a dollar value of $100. The assumption is that the full price retail value is 2x the net sales numbers reported in the brand’s income statements.
Hands down the best article I have read on the internet in years. Thank you.
Thank you!
Hi being a production person this article gives me clear picture how that 80% works in sale price apart from the making 20%. Thanks Robert
Overall an excellent article. To say Nike sucked at the garment segment vs. Adidas may not be accurate. It might just mean that they choose not to make apparel a competitive advantage by over investing in it.
Thanks – perhaps solereview’s choice of word is a bit harsh to describe Nike apparel, but the truth is that they haven’t done anything innovative in that category.
Their compression apparel product line is basically inspired by Under Armour, and other categories like hoodies, graphic tees and polyester shorts and singlets is pretty basic fare.
For a public company like Nike, and with the kind of brand and financial power at their disposal, they should try harder at growing apparel.
Their hard goods (equipment) business is much better.
i remember reading somewhere (niketalk forums, confessions of a nike employee i think???) that the reason Nike created the Pro-Combat line is because their sales reps are sick and tired of getting orders for “those under armour base layers”
It is very possible, can’t be coincidence that Nike develops its own line after UA’s comp apparel business took off.
Fantastic read
interesting insight of a specific sector.
Interesting video – you explained the gist quite well. Like you said, it was a surface discussion.
Your analysis is definitely the best breakdown I’ve ever seen anywhere. It’s excellent. I’m going to Press This to my site because it’s definitely important for those who write everyday to ask how to start their own footwear company.
Thank you for the kind words!
Amazing article! thank you so much! would be also really interested in seeing the costs of a physical store vs an online store
Thanks for the feedback. We’ll see what we can do!
Interesting article but where do the design costs fit in? Or do they just use robots who are able to look into the future and predict what the public is going to like and buy?
The design costs are part of the $11 – other expenses and overheads.
No robots, sadly.
Very nice article. With so many business topics discussed, I can see this article being used as a case study to teach an entire college course.
Presumably the cost to produce is lower, as a percentage, for a higher value shoe; as are fixed costs (costs remain same unless designer royalties are involved, like Nike incurs in Japan), but marketing spends are higher both in absolute and in percentage. Looks like the only way to reduce price is to reduce retail costs. If you don’t want to do away with good salespersons, then the next best thing for retailers to do is to do time share on space. Run the shoes and sports apparel and accessories stores only from 4-8pm when their target audience is free. Space is used for other business during the day. Thanks for the excellent analysis and infographics
Such a fantastic article. Well done! Read something this sharp after a really long time.
Thank you!
Very useful and complete article. Especially the cost analysis of the different channels of sales. I am going to recommend the reading of it to people I know in a #startup.
Thank you. Some of the general terms used here apply for most businesses.
A credit insurer told me that a few years ago he had to visit someone from Adidas when one of their suppliers went bankrupt and didn’t pay them.
He was told that Adidas do not actually manufacture the goods, they received their revenue in licensing fees from manufacturers. In other words they charge manufacturers for the right to manufacture and sell their goods to wholesalers/consumers/retailers.
The logic was that the brand did not have to pay out on storage/distribution etc, saving vast overheads.
This does seem to explain why “fake” factories can produce the same product for so much less. They would simply manufacture the products without paying any license fee to the brand.
Your article seems to contradict this, assuming every model/article made is ordered, manufactured, stored and distributed by the brand.
So, my question is, is this correct? Or have I been misled? Or is the truth somewhere in the middle?
(I really enjoyed this article, I’m not trying to be clever)
You’re correct, brands do not own any factories, and hence technically does not ‘manufacture’ the products directly.
That said, the brands have control over everything else. They brief the design, work together with the factory to get the products made to their specifications. Then the brands take over from there – the retailers might get their products without the brands ever touching it, but the intermediary will be a logistics company (paid by the brand) which consolidates goods for drop-shipment.
The brands will store products meant for their own stores and non-drop ship stock.
Which country are you specifically referring to? What you say is true only for a license to distribute and manufacture model. In such cases, the brands will sign an agreement with a third party in a country who is given a license not only to sell branded products, but also manufacture them.
Brands do this because there might be some countries with a high complexity of doing business (say Latin America or India), and so it makes sense to enter a joint venture or a royalty based market-and-manufacture model in that country.
But this business model is an exception. What solereview’s article focuses on is the norm, where brands control most of the process.
Thank you for that terrific and prompt answer.
Looking at “Revenue and gross margin explained” diagram, which uses an example of assumed landed cost as $22, then comparing it to the following paragraph from your article:
“As you can see in the infographic above, a $100 shoe ends up being $28 in landed costs and the brand sells it to a third party retailer for$50. For a brand, the gross margin in dollar value is $50-$28= $22.
In percentage terms, it will be $22/$50 x 100 = 44%. This gross margin number is included in income statements made available to Wall Street.”
The numbers don’t line up. Please correct me if I’m mistaken.
Many thanks for the catch! Fixed the typo to have the numbers line up with the infographic.
i’m not totally agreeing with that, regarding nike, nike is the biggest retailer, nike’s expenses are covered by budgets in marketing and other expenses,… ok, net margin is small but it’s what they want to show because of taxes… the production cost is interesting to see how lean it should be, after years of sales, why do we spend that big amounts in marketing, and other expenses, it should be reduced and it’s false to say that their profit is low, it’s extra profit…. all salaries and costs are already cut. It will be interesting to see a product launch with 0 marketing, small expenses (like only online) with small price.
I’m surprised that your analysis says the factories make 7% to 10% Profit Margins. Standard contract manufacturing profit margins in other industries are not that high.
That is standard for athletic footwear manufacturing. Those are pre-tax numbers, though, and based on the factory (material+LOH) cost, not the retail price. When calculated as a part of the $100 price, then a 7% number will translate into 1.5%.
I feel these are factories making 10000 shoes a day.
This is a nice tutorial on prices. One thing to keep in mind though, in the end the price is based on supply and demand. The companies have to adjust/tailor their costs to ensure they end up with a net profit. Otherwise, they go bankrupt.
really complete analysis cost vs profit margin!! any idea about, cost vs quality?
The generalization would be higher production costs = better quality, but exceptions are plenty too.
They look very poor in comparison to what is available from the Far East for $150. But then, there are Americans who will buy inferior products, simply because they are “Made in ‘Murica”. Just look at US-built cars! For the rest of the world, ‘Made in USA’ is either equally- or less-appealing than “Made in Vietnam”.
Hi,
Great article and sleuthing. How did you find exact products on the customs website? Want to look up some other products.
Thanks
Before getting the shipping data, one needs to have the following information in hand:
1) Exact incorporated name of importer and/or exporter
2) HS code for the product category.
3) Country of origin and/or country of import.
4) Shipping name/keyword/code for the product.
Just bumped into this website while looking up the latest Boston Boost AQ5990 reference and apparently they’re showing the info for imports in India : https://www.zauba.com/import-adizero-hs-code.html
Interestingly the Adidas Ubersonic AQ6050 costs 36 euros and sells for 130 euros while the Adidas Boston Boost 6 AQ5990 costs 28 euros and sells for 140 euros…
Thanks for the helpful link – though the India cost data will be around 80% accurate, because the customs there uses a formula which grosses up the factory cost to an ‘assessed value’, which includes further rounding off the CIF value.
This is unlike the US, where the customs duties is not calculated on CIF value.
Nonetheless, Indian websites give a fair idea of import costs.
Great job!
Hey, My name is Dante Holley. I’m having an charity event for people effected by sneaker violence next month. I need help finding more detailed statistics on sneaker violence. If Sole Review experts can help me find more statistics we would love to have you apart of the event to promote the site! Please email me or call me for more details [email protected] or 6097426466
Here are some links:
http://qz.com/554784/1200-people-are-killed-each-year-over-sneakers/
http://www.complex.com/sneakers/2015/05/your-sneakers-or-your-life-25-years-later
such quantitative quality info mate. Do you have any information on the SME space cost of producing footwear?.
Thank you for the comment!
The space cost is a subjective number, because it depends entirely on the location.
Very well written article was fun reading it.
Thanks!
Hello, Nike had a revenue in 2015 of 30.8 billion, and you said that they spent 3.2 b on marketing, meaning more than 10%
How can you put then that a in the shoe’s cost, marketing is only 5%?
Please explain it to me
Thanks
Because Nike’s revenue is at wholesale, not retail price. The infographic shows a $100 shoe at its full retail price, whereas Nike’s revenue is half of that for each shoe.
Nike takes a $100 retail shoe and sells it to a store for $50. This $50 is Nike’s ‘revenue’.
Hope this makes sense.
Landed cost seems incomplete, so many factors inside landed cost including filling rate on shipment process, warehouse cost (cubication per day).
I don’t think the needs for every country of each style can fulfill the maximum filling rate (volume efficiency) during shipment process..
And the sales in the retailer won’t be same for every retail store in daily basis.
This cost also will be affecting indirectly to landed cost.
Is this opinion reasonable enough?
Fair points.
This article was intended to give a general overview of the cost structure without going into a lot of operational detail.
That said, the $5.00 freight cost covers all the expenses. Also, these numbers are based on adidas and Nike’s business which has a sizable scale; for a smaller business importing footwear, the cost structure will look different.
For a smaller importer, warehousing cost might apply both in the country of origin and the port of entry. The importer might have to pay W/H cost when waiting for the vessel ship date, and then again at the receiving port if the goods stay longer due to custom clearance backlog or lack of appropriate paperwork. The rules on demmurage will also depend on the country of import.
A smaller business will also be unable to negotiate favorable CBM rates with the forwarder, and will also have the standard processing and paperwork costs spread over a smaller number of pairage – which increases the landed cost.
A lot of these things do not apply for footwear giants. They have enough volume and clever consolidation techniques to ensure freight productivity.
An upside in retail sales (or the lack thereof) does not affect the landed cost, only the margin.
Nike shoes would be a lot cheaper if people would stop stealing them. I worked at a department store and Nikes were stolen every week.
The theft problem is a serious one – more than 1% of total retail sales!
Hi, great breakdown of costs.
But where are the cost of big exec salaries included?
I think that’s another source of uproar and raging against these companies.
Executive salaries are a part of SG&A costs – represented by “other expenses and overheads” section (purple) in the infographic.
So people “say make it in america”. But others say the price would sky rocket. If you can subtract some lesser amount for freight and customs expense, presumably, how much more might a pair of shoes cost if it were made here in the USA?
Getting to an accurate estimate will take some maths, but a rough guess is (at least) an extra 50% cost to make shoes in the USA.
Most of the materials will still be imported – the US does not have the supplier base for most of the components currently used in athletic footwear. Synthetic leather, foams, adhesives, rubber etc. Ditto for the molds and machinery.
Also, apart from the additional cost of the US labor involved in assembling a shoe, other resources will be far more expensive. Cost of land, regulatory compliance, maintenance of machinery and people involved in administration etc etc. All this will reflect in the final cost of the shoe.
Comments are closed.